H&F recorded 664 crimes that were flagged as a hate crime in 2023 that were reported to the police. This is a rate of hate crime of 3.6 per 1,000 residential population. This is an increase from last year of 16.3% and an increase of 26.5% from 2018.
Year |
Count |
Year on year change |
|---|---|---|
2018 |
525 |
|
2019 |
593 |
13.0% |
2020 |
580 |
-2.2% |
2021 |
641 |
10.5% |
2022 |
571 |
-10.9% |
2023 |
664 |
16.3% |

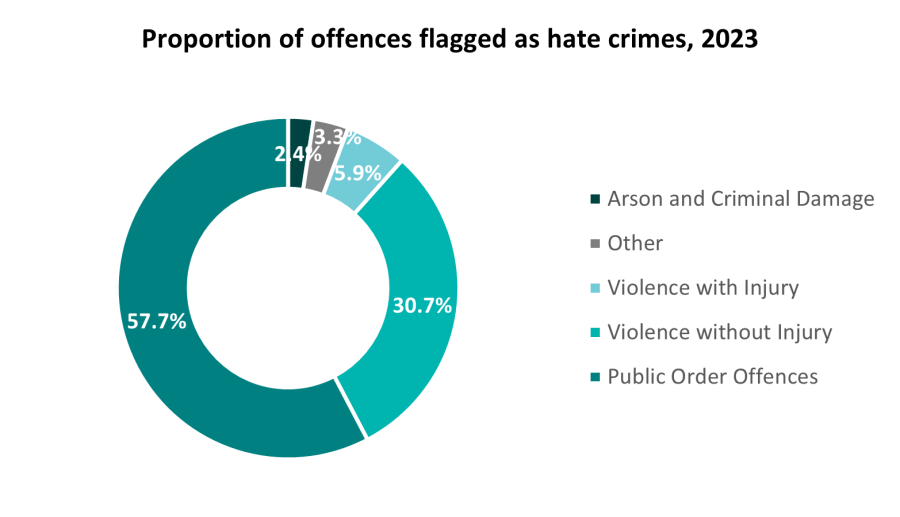
As shown on the graph above, more than half (57.7%) of hate crimes recorded in H&F were Public Order Offences13 and nearly one-third (36.6%) were violence Against the Person where 5.9% were for Violence with injury14 and 30.7% for Violence without injury15
13 The term "public order offence" is used to describe acts of violence or intimidation in public, such as rioting, affray and inciting racial or religious hatred
14 The term "violence with injury" encompasses a range of offences where physical harm is inflicted upon a victim, such as assault, battery or threats that cause fear of immediate violence.
15 "Violence without injury" refers to situations where the victim experiences physical aggression but does not sustain any resulting injury and includes actions such as being punched, kicked or pushed without significant harm.
H&F ranks 15th lowest of 32 boroughs for the volume of hate crimes. However, when comparing rates of crime per 1,000 residential population, H&F ranks 6th highest of 32 boroughs.
As shown in the graph below, racially motivated hate crimes are responsible for the majority of reports in H&F and across London. In the majority of hate crime cases the suspect was not known to the victim.
Racially motivated crimes in H&F and across London comparing rates of crime per 1,000 residential population

Racist
London average: 589
H&F: 512
Homophobic
London average: 98
H&F: 94
Faith
London average: 95
H&F: 77
Antisemetic
London average: 44
H&F: 22
Islamophobic
London average: 36
H&F: 42
Disability
London average: 16
H&F: 23
Transgender
London average: 15
H&F: 9
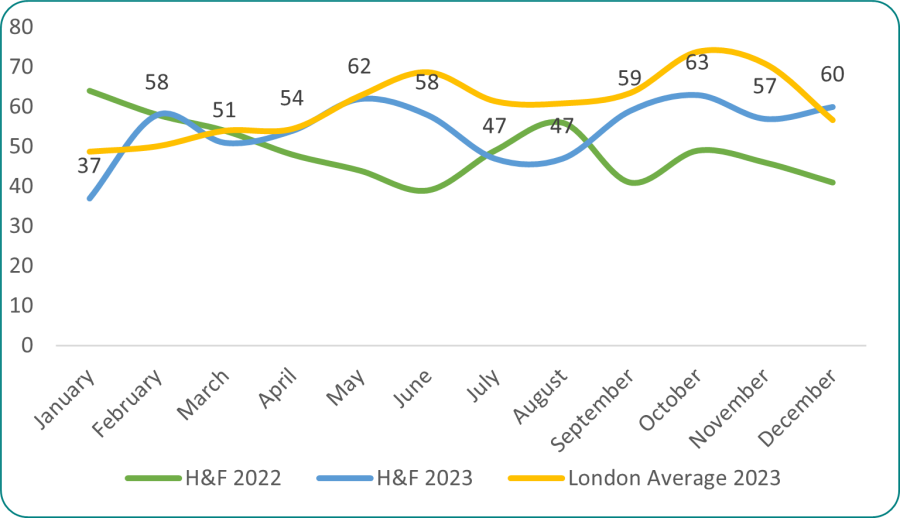
The number of hate crimes reported to the police by month
The graph below shows the number of hate crimes reported to the police by month. In H&F, and across London, the highest number of antisemitic, racist and faith hate crimes offences were reported in October 2023, which is likely linked to the escalation of the conflict in the Middle East.
It shows more cases were reported in 2023 than in 2022 in Hammersmith and Fulham for every month except January and August but that the number of reports was lower than or equal to the London average for every month except February.

Ward comparison
In 2023, the H&F wards where most reported hate crimes took place were Shepherd's Bush Green, Hammersmith Broadway, and Brook Green. This suggests links to areas of high footfall such as town centres and transport hubs. Crimes are recorded where the incident took place.
The wards with the lowest levels of hate crime were Wendell Park, Fulham Town, and Grove. A breakdown of hate crime across all the wards in the borough over the last three years is shown below.
Ward Name |
2021 |
2022 |
2023 |
Rate per 1,000 Residential Population |
|---|---|---|---|---|
Addison |
23 |
30 (30%) |
34 (13%) |
4.4 |
Avonmore |
20 |
15 (-25%) |
11 (-27%) |
1.5 |
Brook Green |
59 |
37 (-37%) |
70 (89%) |
8.5 |
College Park & Old Oak |
50 |
26 (-48%) |
41 (58%) |
4.1 |
Coningham |
35 |
36 (3%) |
49 (36%) |
4.6 |
Fulham Reach |
40 |
28 (-30%) |
41 (46%) |
3.4 |
Fulham Town |
7 |
9 (29%) |
11 (22%) |
1.5 |
Grove |
12 |
19 (58%) |
11 (-42%) |
1.5 |
Hammersmith Broadway |
67 |
76 (13%) |
87 (14%) |
11.1 |
Lillie 2 |
5 |
16 (-36%) |
18 (13%) |
2.7 |
Munster |
24 |
16 (-33%) |
19 (19%) |
1.6 |
Palace & Hurlingham |
10 |
14 (40%) |
11 (-21%) |
1.0 |
Parsons Green & Sandford |
19 |
16 (-16%) |
14 (-13%) |
1.8 |
Ravenscourt |
15 |
16 (7%) |
16 (0%) |
2.3 |
Sands End |
18 |
18 (0%) |
29 (61%) |
2.6 |
Shepherd's Bush Green |
80 |
66 (-18%) |
68 (3%) |
12.2 |
Walham Green |
40 |
40 (0%) |
52 (30%) |
6.5 |
Wendell Park |
14 |
9 (-36%) |
8 (-11%) |
1.1 |
West Kensington 30 23 (-23%) 29 (26%) 3.1 |
||||
White City 39 52 (33%) 29 (-44%) 2.8 |
||||
Wormholt 14 9 (-36%) 16 (78%) 2.0 |
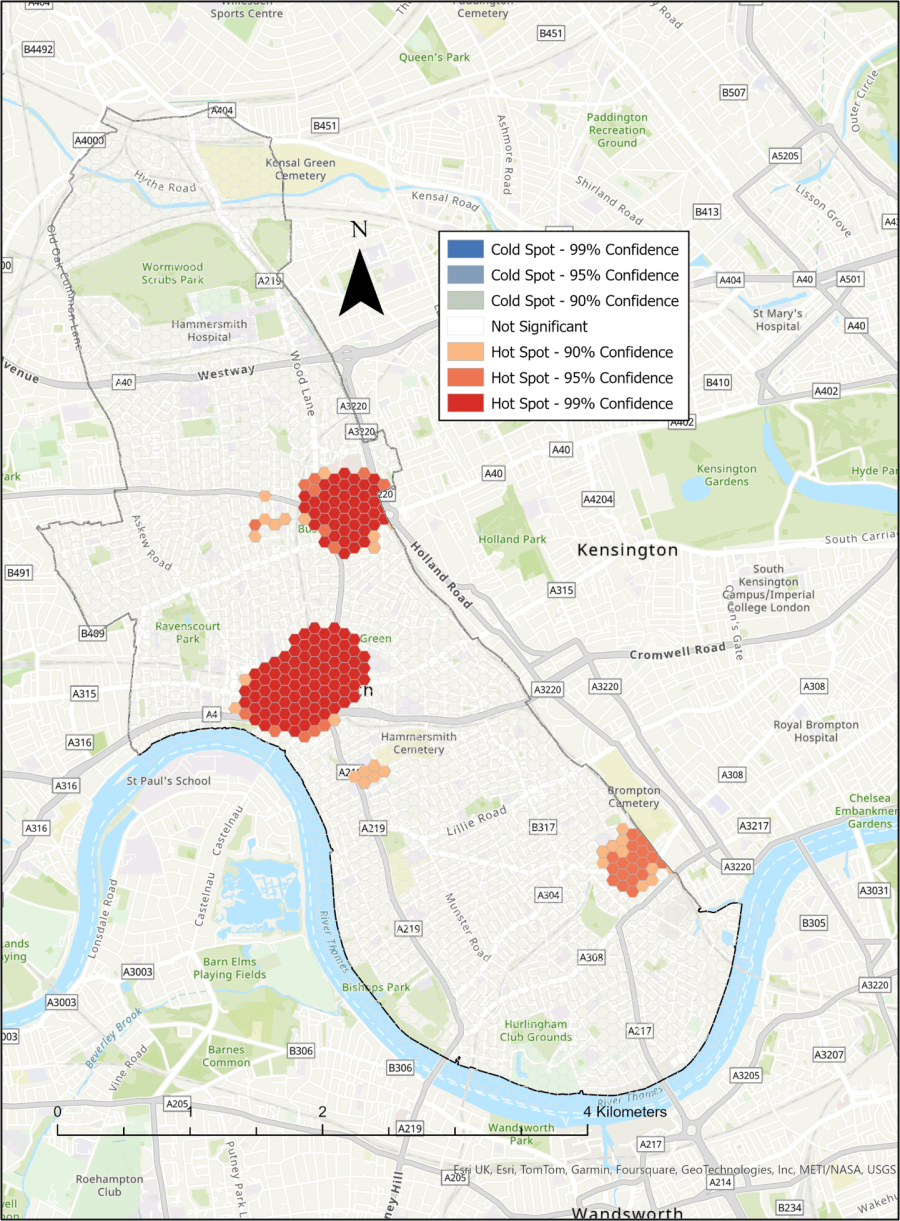
The hot spot areas of hate crime in the borough in 2023
The number of hate crimes reported in 2023 to the police in each 100m2 hexagon area. Shows hot spots of hate crime reports in Shepherd's Bush, Hammersmith Town Centre and Fulham Broadway. There are no areas of the borough where a statistically lower number of hate crimes were reported.
