Deprivation
2
LSOAs in the 40% most deprived
42%
income deprived residents
4
LSOAs in the IDACI 20% most deprived
3
LSOAs are in the IDAOPI 20% most deprived
The ward is made up of 5 Lower Super Output Areas (LSOAs) and in 2019 was measured as less deprived than in 2015 and 2010.
2 LSOAs are ranked within the 20% most deprived nationally.
The highest deprivation scores are in the domains for:
- living environment
- barriers to housing and services
3,354 residents (42%) are income deprived compared to 24% in H&F, while 1,903 working-age adults (33%) are employment deprived compared to 15% in H&F. Both measures are in the 20% most deprived.
4 LSOAs fall within the worst 20% deprived nationally on the Income Deprivation Affecting Children Index (IDACI) and 3 fall within the worst 20% nationally on the Income Deprivation Affecting Older People Index (IDAOPI).
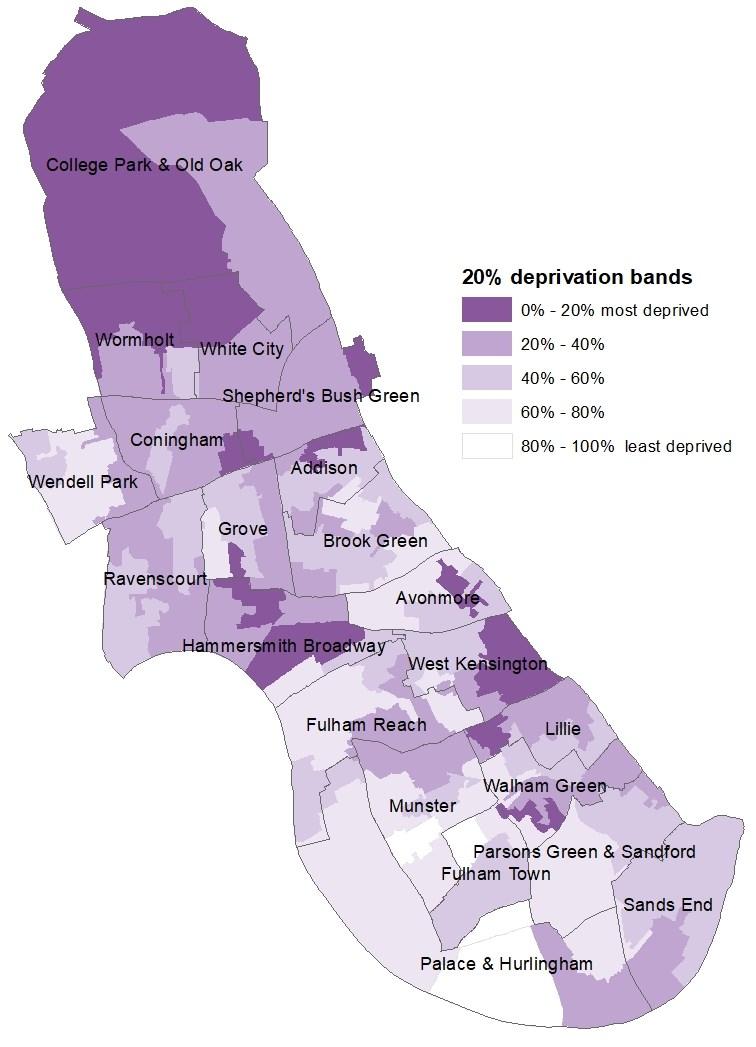
The following graphic shows the deprivation levels across the borough.
Crime
487
offences recorded
61
offence rate per 1,000
21
violence rate per 1,000
50%
are without a car or van
All recorded offences have grown across the borough over the past year (+10% in the year to 2023). The ward has seen a 6% decrease in total notifiable offences in the last year. This is the 3rd highest decrease among all wards.
In 2023, 487 offences were committed (61 per 1,000 residents), ranking the ward highest in H&F.
The highest volume of offences in the ward were for:
- violence against the person (166)
- theft (74)
- vehicle offences (66)
1 crime type in the ward has seen a larger rate per 1,000 population compared to the borough average, this was sexual offences (0.6% points difference). The smallest rate compared to the H&F averages was theft (-24.4 % points difference).
Offence types |
Offences in the ward |
Ward rate |
Offences in H&F |
H&F rate |
|---|---|---|---|---|
Violence with injury |
56 |
7.0 |
1,749 |
9.5 |
Violence without injury |
110 |
13.8 |
3,504 |
19.1 |
Sexual offences |
23 |
2.9 |
427 |
2.3 |
Robbery |
14 |
1.8 |
614 |
3.4 |
Arson and criminal damage |
32 |
4.0 |
1,273 |
7.0 |
Burglary |
33 |
4.1 |
1,346 |
7.3 |
Theft |
74 |
9.3 |
6,169 |
33.7 |
Vehicle offences |
66 |
8.3 |
2,922 |
16.0 |
Public order offences |
32 |
4.0 |
1,526 |
8.3 |
Drug offences |
36 |
4.5 |
934 |
5.1 |
Total |
487 |
61.0 |
20,788 |
113.5 |
Car ownership
The proportion of households without the use of a car or a van stands at 50%. This compares to 57% in H&F and 42% in London.
There are 60 cars per 100 households in the ward compared to 51 in the borough and 81 in London.