Economy and labour market
61%
economic activity rate
36%
in full-time employment
10%
in part-time employment
42%
working mainly from home
11%
retired
61% of residents in the ward were economically active (working or looking for work). This compares to 66% in H&F.
The female economic activity rate was 57% and for males was 66%.
36% of residents aged 16+ were employed full-time (41% in H&F) and 10% part-time (8% in H&F).
42% worked mainly from home in 2021 (52% in H&F and 42% in London).
293 residents (5%) were unemployed and looking for work. This compares to 4% in H&F.
24%
in professional occupations
48%
have a degree level qualification
16%
have no formal qualification
1,932
full-time students
The health and social work sector is the largest source of employment with 13%, followed by wholesale and retail trade (13%) and education (11%).
14% of the employed population were working as managers, directors and senior officials (19% in H&F), while 24% were working in professional occupations (30% in H&F).
8% were working in administrative and secretarial occupations (7% in H&F) and 9% in elementary occupations (6% in H&F).
16% of adults have no formal qualification compared to 12% in H&F and 16% in London.
48% have a level 4 qualification-degree level (58% in H&F and 47% in London).
There are 1,932 schoolchildren and full-time students in the ward. This is 26% of the ward population aged 5+ compared to 21% in H&F.
Company |
Employees |
Sector |
|---|---|---|
The Queensmill Trust |
286 |
Primary education |
Future Academies |
59 |
Secondary education |
GRV Media Ltd |
52 |
Business support service activities |
Wormholt Park Primary School |
47 |
Primary education |
Cambridge Special School |
45 |
Primary education |
Aylesbury Ltd |
44 |
Non-life insurance |
Q Plus |
41 |
Residential care activities |
Greenwich Leisure Ltd |
37 |
Operation of sports facilities |
Wursty Four Biers Ltd |
24 |
Beverage serving activities |
Red Squirrel Tree Surgery Ltd |
23 |
Manufacture of basic metals |
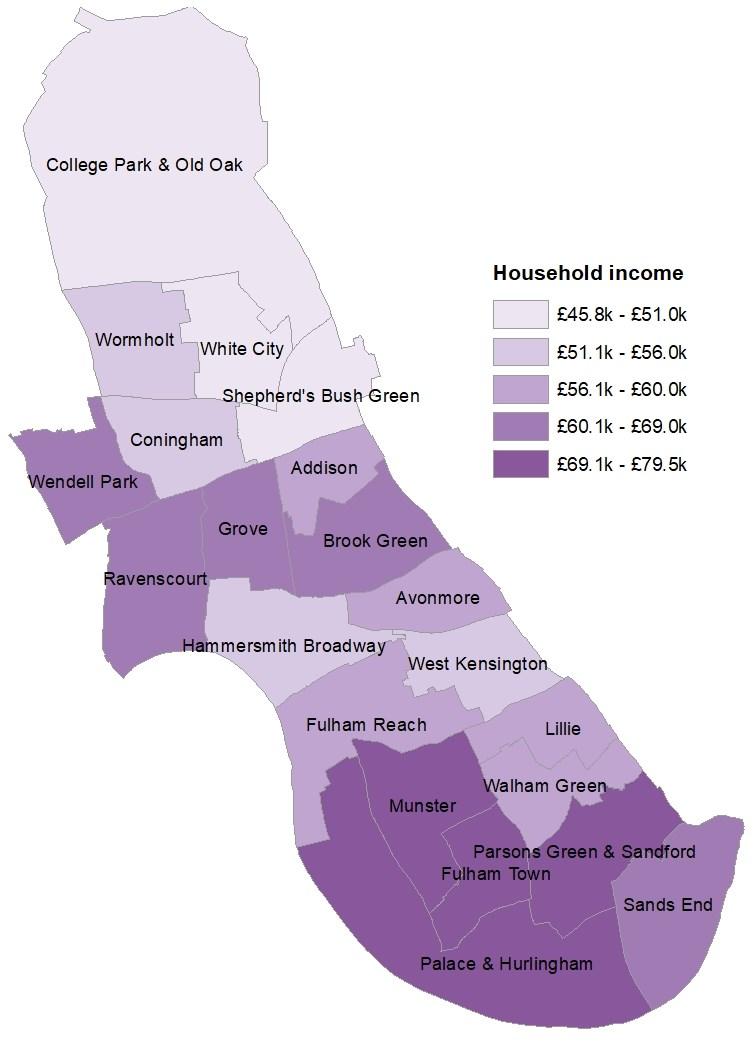
Household income
The average gross household income (including investment income and social security benefits) in the ward is £54,454 per annum (£61.1k in H&F and £55.4k in London).
29% of households depend on less than £30,000 per annum compared to 24% in H&F, while 22% have an income of over £80k (28% in H&F).
The following graphic shows the average household income levels across the borough.
Cost of living
469
Housing Benefit claims
1,089
Universal Credit claims
349
pupils on free school meals
13%
fuel poor households
The total number of Housing Benefit (HB) claimants in the ward stands at 469 (16% of households) compared to 12% in H&F.
Most HB claimants (91%) live in the social rented sector (89% in H&F), while the remaining 9% rent their property privately.
In December 2023, there were 1,075 Universal Credit (UC) claimants in the ward. This is 23% of the 16+ population compared to 13% in H&F.
67% of all UC claimants were not in employment (65% in H&F).
199 residents received Pension Credit benefit. This is 17% of all aged 60+ compared to 17% in H&F.
The number of pupils attending schools and living in H&F receiving free school meals stands at 349. This ranks the 3rd highest among all wards.
The ONS has estimated that 13% of households in the ward are fuel poor (11% in H&F and 12% in London).
Owners and private renters are less likely to be fuel poor than those in social rented housing.