Population
183,157 people
Number of residents
+664 people
+0.4% change since 2011
81,244
Number of households
53% female, 47% male
Gender split
H&F had 183,157 usual residents in 2021, an increase of 664 people (0.4%) since the 2011 Census.
Females make up 53% of the total population compared to 47% of males.
The median age of the borough is 34 years. This is lower than both London (35) and England (40).
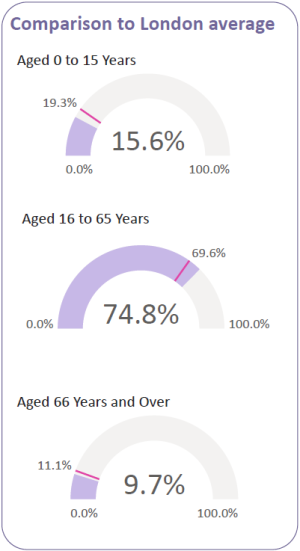
16% of the population is under 16 (19% in both London and England).
Working-age people account for 75% of the population, which is higher than both London (70) and England (64).
The population aged 66+ years has increased by 16% in the past 10 years and now stands at 10% of the total population This compares to 11% in London and 17% in England.
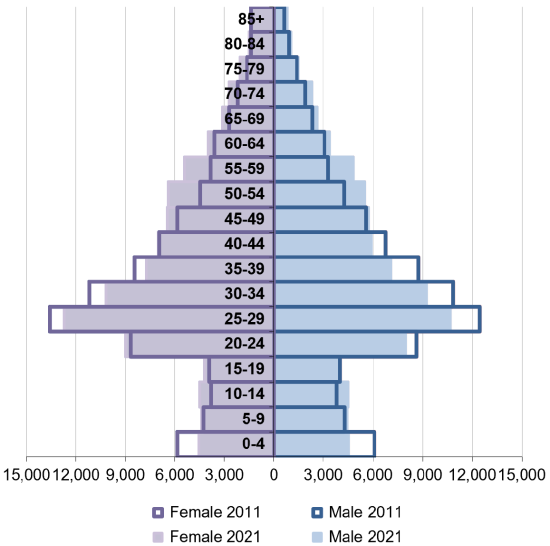
The population pyramid compares the 2021 age and gender breakdown with 2011. It is clear that the borough population is relatively young for both genders with a large proportion in the age range 25 to 39.
H&F is the country's 6th most densely populated area with a population density of 11,161 people per square km. It is twice as densely populated as London (5,598 persons per square km).
Diversity
37%
Ethnic minorities
46%
Foreign-born residents
14%
No English speakers
31%
No religion stated
H&F ranks in the top 20 in England for the proportion of LGBT+ people to the total population. This is 5.3% (8,220 people).
1,120 residents aged 16+ years (1%) stated that their gender identity was different from their sex at birth. This is the 27th highest in the country.
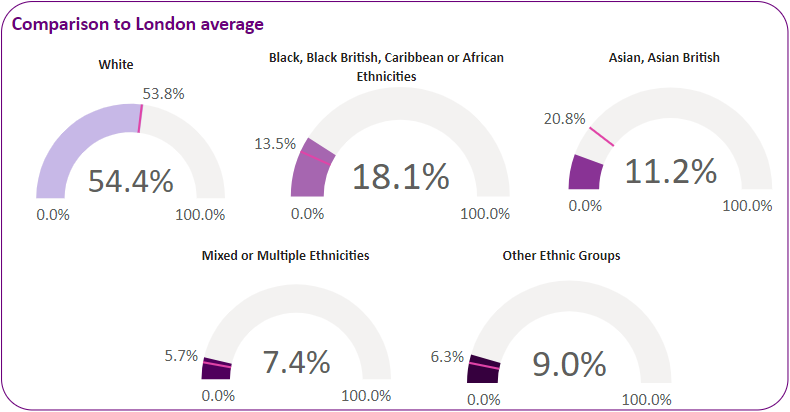
H&F remains ethnically diverse and saw a 7% increase in people who are from an ethnic group other than White British (62%). White British is now 38% (45% in 2011). Despite this ethnic diversity, 7 in 10 people still identify with a UK national identity.
The borough ranks the 5th highest in England in terms of proportion of Other White population to total population (22%) and the 5th highest in the proportion of an Arab population (3%).
The main ethnic minorities identified are:
- Black African (7%)
- Mixed (7%)
- Black Caribbean (4%)
- and Arab (3%)
Foreign-born residents made up 46% of the borough's population in 2021 (London 41% and England 17%). This is the 11th highest level of any local authority in England.
Italy supplied most foreign-born residents (5,408), followed by:
- France (5,094)
- United States (3,422)
- Spain (3,258)
- Ireland (3,036)
- Philippines (2,943)
11,146 H&F households (14%) have no people that speak English as a main language.
The main foreign languages spoken in the ward are:
- Spanish
- French
- Portuguese
- Arabic
- Italian
- Polish
- Somali
Christians remained the largest religious group in the borough with 46% of residents (41% in London). 12% of residents identified as Muslim (15% in London) while 31% stated as having no religion.
There were an estimated 81,244 households with usual residents in H&F, an increase of 654 (0.8%) since 2011.
The average household size is 2.25 persons. This is the 5th lowest average size of any local authority in London.
27% of households consist of a single person under pensionable age (21,973 people). This is the 7th highest level in the country.
In 2021, 23% of households had dependent children. 7% of those are lone-parent households (5,354).
Health and disability
87%
have very good or good health
12.5%
are Disabled residents
6%
provide informal care
6% of females and 5% of males
are limted a lot
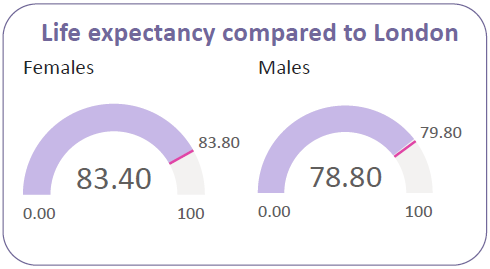
Life expectancy in the borough is similar for females to the London average, while it is slightly worse for males.
Females are expected to live 83.4 years (the London average is 83.8 years) and males are expected to live 78.8 years (the London average is 79.8 years).
87% of residents declared themselves in good or very good health (85% in London and 82% in England).
12% (22,972 residents) reported having a long-term health problem or disability that limits their day-to-day activities. This is lower than both London (13%) and England (17%).
6% of females and 5% of males reported their day-to-day activities being limited a lot.
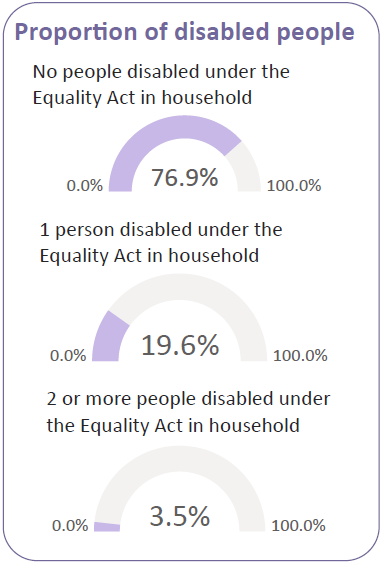
76.9% of households in the borough do not have a Disabled member, while 19.6% of households include 1 Disabled member and 3.5% include 2 or more Disabled people.
Around 6% of the population aged over 5 (10,738 residents), provides unpaid care every week. This is lower than the regional average (7%) and national average (9%). It is the 3rd lowest level in England.