Deprivation
20
LSOAs in the 20% most deprived
24%
income deprived residents
2
LSOAs in the IDACI 20% most deprived
3
LSOAs are in the IDAOPI 20% most deprived
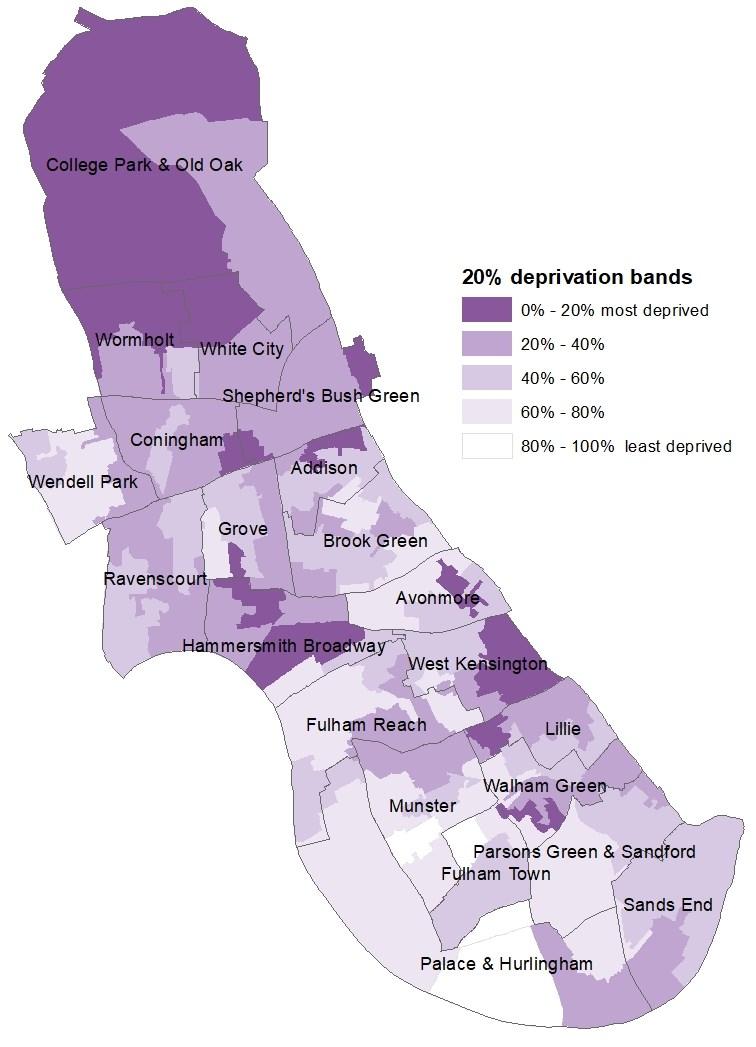
H&F is made up of 113 Lower Super Output Areas (LSOAs) and in 2019 was measured as less deprived than in 2015 and 2010.
It is the 112th most deprived out of 317 local authority districts in England. 20 LSOAs (18%) are ranked within the 20% most deprived nationally.
The highest deprivation scores are in the domains for:
- living environment
- crime
- barriers to housing and services
24% are income deprived compared, while 14% of working-age adults are employment deprived. Both measures are in the 20% most deprived.
32 LSOAs (28%) fall within the worst 20% deprived nationally on the Income Deprivation Affecting Children Index (IDACI) and 59 fall within the worst 20% nationally on the Income Deprivation Affecting Older People Index (IDAOPI).
The following graphic shows the deprivation levels across the borough.
Crime
20,788
offences recorded
113.5
offence rate per 1,000
51
violence rate per 1,000
67%
are without a car or van
All recorded offences have grown across the borough over the past year (+10% in the year to 2023) as crime levels return to a level closer to that seen before the pandemic. Total offences are 6% below those in 2019.
Crime and footfall are closely linked, and despite a high level of footfall, the borough ranks the 4th lowest across London for crime rate per 1,000 average daily footfall for visitors.
Crime continues to be concentrated around high footfall areas in Shepherds Bush Green and Hammersmith Broadway which account for 26% of all offences.
In 2023, 20,788 offences were committed in H&F (113.5 per 1,000 residents), ranking the borough 7th highest in London.
The highest volume of offences in the ward were for:
- theft (6,169)
- violence against the person (3,504)
- vehicle offences (2,922)
Offence types |
Offences |
Rate |
|---|---|---|
Violence with injury |
1,749 |
9.5 |
Violence without injury |
3,504 |
19.1 |
Sexual offences |
427 |
2.3 |
Robbery |
614 |
3.4 |
Arson and criminal damage |
1,273 |
7.0 |
Burglary |
1,346 |
7.3 |
Theft |
6,169 |
33.7 |
Vehicle offences |
2,922 |
16.0 |
Public order offences |
1,526 |
8.3 |
Drug offences |
934 |
5.1 |
Total |
20,788 |
113.5 |
Car ownership
The proportion of households without the use of a car or a van stands at 57%. This compares to 42% in London.
There are 51 cars per 100 households in the borough compared to 81 in London and 125 in England.