Legal partnership status
2 in 5 residents (40%) aged 16+ are living as a couple (43% in H&F and 50% in London).
The ward ranks high (46%) in proportion of residents who are single-never married (44% in H&F). Proportionately fewer residents are married (26%) compared to the borough average of 29%.
Housing
3,658
total dwellings
92%
are flats or maisonettes
37%
are 1-bed properties
35%
are 2-bed properties
£740k
Average price of dwellings
In 2021 there were 3,658 dwellings in the ward and less than 1% of dwellings were shared between 2 or more households.
The housing stock is characterised by a large proportion of flats and maisonettes (92%), ranking highest in H&F.
37% of all properties have 1 bedroom (ranked 6th highest) and 35% have 2 bedrooms (ranked 4th lowest).
The average price of dwellings in the ward is £740,354 compared with £726k in the borough and £584k in London.
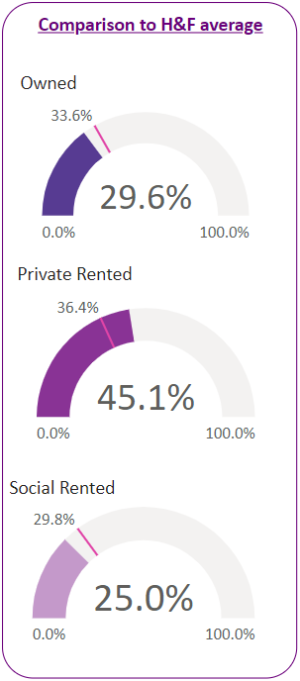
Household tenure
The private rented sector (including rent free) is the largest tenure and accounts for 45% of all households (44% in 2011) compared to 36% in the borough as a whole.
30% of households are owner-occupied (33% in 2011) compared to 34% in H&F.
25% rent their home from a social housing provider (23% in 2011) compared to 30% in H&F. 12% rent from the council (ranked 10th lowest) and 13% from housing associations (ranked 9th lowest).
Occupancy levels
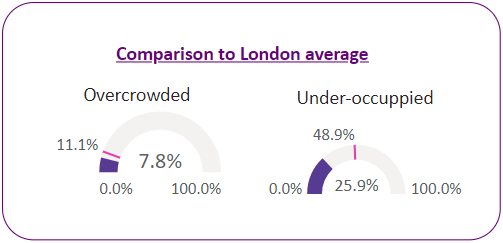
The proportion of households identified as living in overcrowded homes (have 1 fewer bedroom than required) is 8% (284 households) which is above the borough average of 9% (11% in London).
26% of households are under occupied by 1 bedroom and a further 11% by 2 or more bedrooms (37% in total). This compares to 43% in H&F and 49% in London. Under occupancy means there are more bedrooms than required.
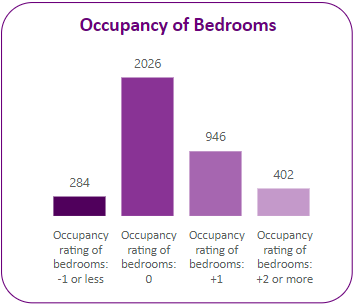
Occupancy is calculated by comparing the number of bedrooms the household requires to the number of available bedrooms based on the bedroom standard. Occupancy rating for bedrooms variable: Census 2021 - ONS.GOV.UK
In Avonmore ward:
- 284 households have 1 fewer bedroom than required
- 2,026 households have the right number of bedrooms required
- 946 households have 1 bedroom more than required
- 402 households have 2 bedrooms more than required